Searching for value in universe screens...
ASX Small caps & Micro caps, enterprise value/EBITDA, determining if a stock is cheap or expensive.
To start off the year we thought we would publish an interesting screen from the universe of stocks that we look at for H&G’s High Conviction Fund. (That is ASX listed Small and Microcaps, 10-150 million in market cap).
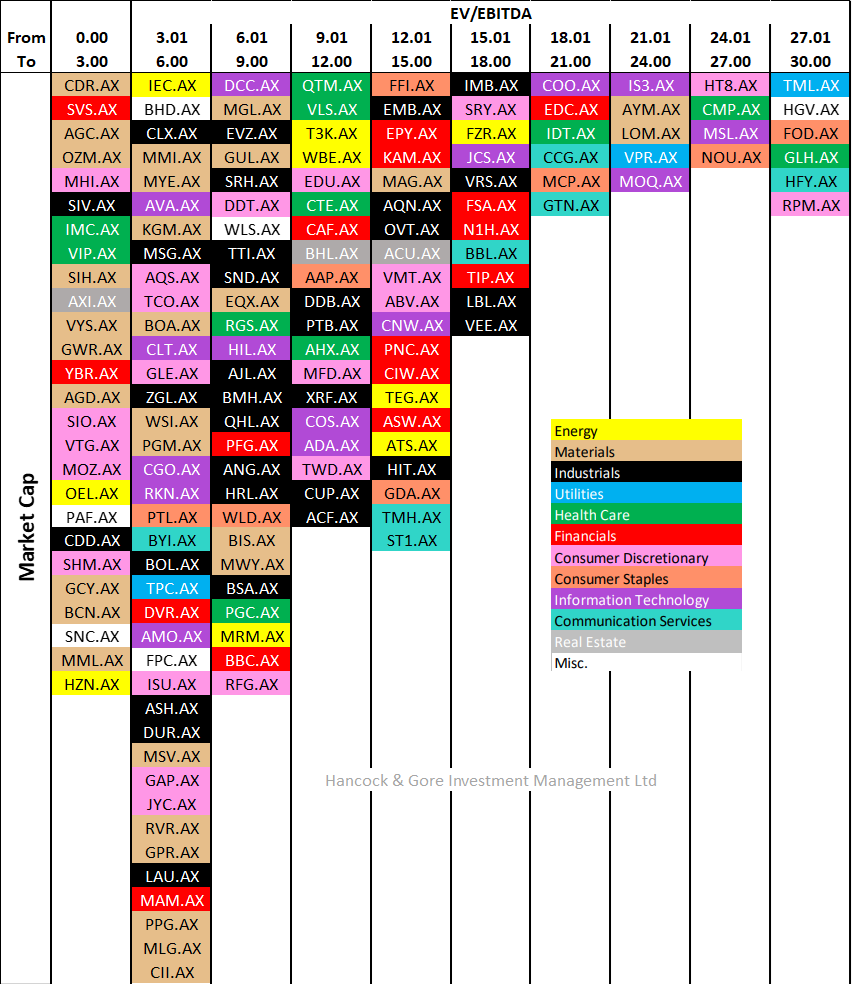
One metric we use to gauge where a particular stock sits in the universe compared to its sector and peers is the enterprise multiple.
“Enterprise value/Earnings before interest, tax, depreciation & amortization (more commonly referred to by the acronym EV/EBITDA) is a popular valuation multiple used to determine the fair market value of a company.”1
It is best viewed as a relative valuation metric, and/or a proxy for discounted cashflow.2
When displayed as a histogram with EV/EBITDA buckets against size (market capitalization) and each GICS Sector colour coded it is easy to quickly scan through the universe for potential opportunities for further research.
9 Jan 2022
*Data is sourced from Refinitiv/DataStream using latest available company filing and may not reflect any proforma M&A announcements or corporate actions. The above is merely an indicative screen from which to base further research and does not represent a recommendation for or against any companies shown.
We hope you find this resource useful.
The chart for this article is an extract from our weekly brief sheet that provides a market round up, a selection of useful data points we use for our investment analysis, and some interesting articles/charts we have noticed recently.
If you would like to receive our weekly brief sheet directly in your email every Monday please sign up here.
https://www.morganstanley.com/im/publication/insights/articles/article_everythingisadcfmodel_us.pdf


